Finding data, XY data, & GPS
Contents
- Part 1: Exploration of MassGIS & ArcGIS Online
- Objective: Explore the different layers available for download in MassGIS and upload data to ArcGIS Online
- Part 2: Creating Data from an XY Table
- Objective: To create a vector layer from an XY table, using as an example the locations of events in the Syrian conflict for the year 2012.
- Part 3: Create a map of trees on campus
- Objective: Create a point layer from GPS readings
Part 1: Exploration of MassGIS & ArcGIS Online
Task 1: Exploration of the Q drive, MassGIS, and other data sources
- Explore the content of the Q:\ drive using the Windows Explorer and ArcGIS. Look into the following folders for available data:
- \Data&Maps2023 – general data from Europe, USA, and the world (navigate to each sub-folder and load (drag to the CP or just double click) the .lyr files to visualize them
- \USA_Demographic_Data – very detailed demographic data of the USA (study the document “2021 Esri Demographics Complete FGDB Layout.pdf” for content and variable names; it’s very long, a printed copy is saved in the cabinet where we keep the textbooks in the GPL).
- Look at the two digital data sources provided in the GIS resources page (General GIS data & State GIS). Study them and look for something that you can use in your project.
- Go to the MassGIS data layers webpage and study the layers available for download. Look for possible data to use in your final project.
- Get the municipalities’ and police stations’ layers. Download either shapefile or GeoDB and expand (unzip) the files in a new working folder in your X drive.
Hint: there are a couple of town layers, either one should be fine.
Question 1. How many municipalities (cities/towns) don’t have any police station?
- Remove ALL joins and save the project containing ONLY 2 layers: municipalities & police stations. Keep it simple, nothing fancy. We’ll use this for the next task.
Task 2: Uploading to ArcGIS Online
- Open the project (if not open) that you saved above (#3).
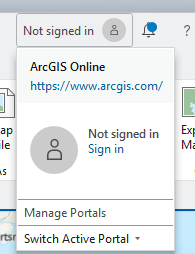
- In the upper right corner of ArcGIS Pro window click to sign in to your ArcGIS Online (AGO) account (same as the Storymap).
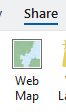
- After signing in go to the Share tap in the ribbon and click on Web Map in the “Share as” group.
- In the pane that opens on the right enter the following:
- Name: Towns & police stations in Mass. (or something suitable)
- Summary: something more descriptive of the layer if your name was not very clear
- Tags: Massachusetts, towns, police stations, (or any suitable)
- Select a Configuration: Copy all data: Exploratory
- Location: choose Create new folder and name it with a suitable name (e.g. policemass)
- Sharing Level: Organization (so we can see it, if necessary, otherwise “Owner” (if private) or “Public” (if sharing with others)
- Push the Analyze button at the bottom.
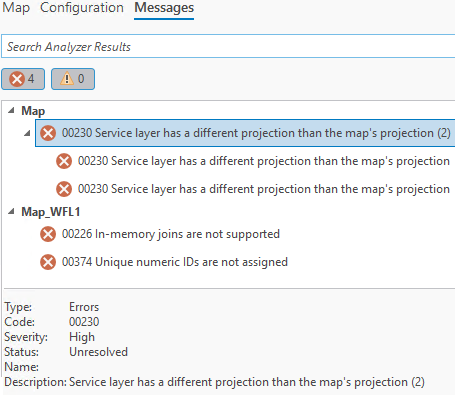
Analyze produces a series of errors that need to be addressed before uploading the data. Notice that errors with a red sign must be resolved before continuing. Yellow sign errors should not prevent you from continuing, they’re only warnings.
These errors are pretty much unavoidable. This rarely works without errors the first time. We’ll work on these errors by clicking on them. The example below addresses my errors which might be different from what you get.
- Click each error and notice the description that it shows below.
- Error 00230 Service layer has a different projection … – this happens twice because I have the two default basemaps in my map
- Error 0026 In-memory joins ... – I forgot to remove the join I did of police stations and towns
- Error 00374 Unique numeric IDs not assigned – I guess that something needs unique IDs 😐
- To solve these errors, I did the following:
- Double click on each of the 00230 errors – they magically transform to error free (green)
- For the 00226 error I removed the join I had on the town layer, saved the project, and went through the process again
- Unique ID error: double click on it and a Map Properties window opens. Under the General tab check the tick box that says “Allow assignment of unique IDs….” and push OK
- Push the Analyze button again and all errors should be clear now
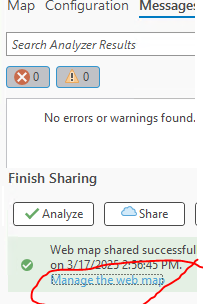
- Push the Share button at the bottom and wait for the process to finish (be patient).
- You’ll bet a green message “Web map shared successfully”
- Click on the link “Manage the web map” and it’ll take you to ArcGIS Online
- Login to your AGO account and you will see your map there
- Click on the Open in Map Viewer button to open it in AGO
- The map can now be added to a Storymap.
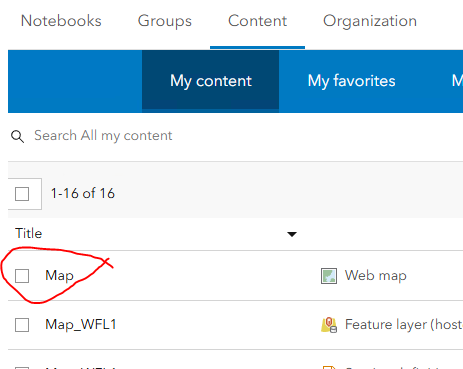
- If you don’t see the link, just go to your AGO account and you’ll find it under the Content\My content tab
NOTE 1: Be aware that changes made to the map in AGO (such as adding a different basemap, etc.) won’t transfer back to the original version saved in Pro, and that you’ll likely need to refresh the StoryMap for edits made in ArcGIS Online to appear.
NOTE 2: the maps you see in AGO are images (screen shots) sent by the server. They do not contain the underlying data (e.g. shapefiles). Only if the author of the map has configured it in such a way that the data can be downloaded then you’ll be able to get the feature layers. The document “Sharing Data” shows you how to configure this simple map (police stations in Mass) to allow downloading data. This is an advanced topic and optional. You’d need this when you have your own data and research project and want to share your data with other researchers.
Question 2. Copy the URL of your map in ArcGIS Online and submit it in Moodle. Make sure it can be accessed (try it on a different browser)
Part 2: Creating data from an XY table
Here you will create a vector theme to show the distributions of conflict during the Syria war during the first 3 months of 2012. The spreadsheet “XYGDELT_2012_jan-march.xlsx” in your data folder contains locations of material conflict events, as reported in the media. Each one of these events can be one or multiple casualties, bombings, etc. This data was obtained from the GDELT project.
You’ll also use a GeoDB (UNOCHA WGS84.gdb) with the political divisions of Syria produced by the Office for the Coordination of Humanitarian Affairs, UNOCHA.
Task 1 – Adding XY data
There are multiple ways to add XY data in ArcGIS. The simplest is to use the Go to XY button on the toolbar (see figure below). This allows you to enter one by one data in different units, depending on what you have and the coordinates of the underlying map. This is a very quick way to add a few points (maybe collected with a GPS during a field trip), but it’s not convenient when we have many points.
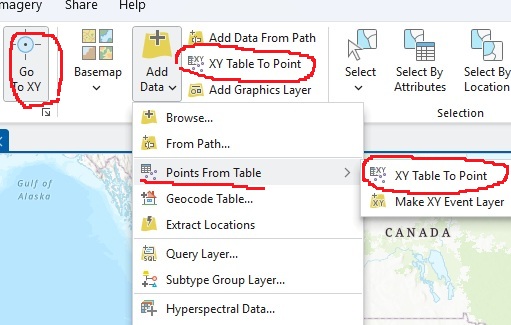
The most efficient way to add XY data is to create a table, with a suitable software (like Excel), containing the X and Y coordinates (in decimal degrees, not DMS) of your locations, along with any other extra data you may have about each location (attributes). Then you use the XY Table to Point buttons (shown in the figure above in 2 parts, same button) in the Layer group of the Map tab.
To avoid compatibility problems, I always make a simple table in Excel using simple headings (short file name, no spaces, and short column names). In theory, you should be able to directly access the data from an Excel table (as we did in the previous part).
NOTE: Always make sure that values of Lat or Long have, if necessary, negative signs. In the case of Syria both values are positive, but if you had coordinates for the US, Longitude values must be negative.
- Create a new Blank Map.
- Add the feature classes Admin1_Governorate_Mohafaza and Neighboring_Countries, from the UNOCHA WGS84 GeoDB into a blank ArcMap view.
- Label the neighboring countries and the governorates of Syria (instead of neighboring countries you could use a suitable base map, but not both).
- Add the table XYGDELT_2012_jan-march.xlsx to ArcGIS Pro and open it (be patient, it’s a long table; since Excel files can have multiple tables, you always have to pick the table). Study its contents.
Question 3. How many records are there in this table? ___________ (Hint: it’s >100k; if the table only shows “0 of *2000, click the “Load All” button)
We’ll use the Columns Actor2Geo_Lat and Actor2Geo_Long (Actor2 is the “receiving end” of the action).
- Select only the records that contain a value <= -7 in the GoldsteinScale column (This is a scale of intensity of conflict or cooperation; it ranges from -10, very bad, to +10, very good).
Question 4. How many records have a Goldstein Scale less than or equal than -7? ______ (Hint: less than 30k)
- Export the selected records to a new table and save it in the default GeoDB.
- Right click on the table in the CP DataExport
- Use XY Table to Point button in the Map tab (see previous image)
- Make sure that the X and Y fields are correct (use corresponding lat long columns for Actor2)
- For the Coordinate System make sure that GCS_WGS_1984 is selected.
- Run
Hint: All the points MUST fall within Syria, if not, you might have switched lat-long variables)
One problem with this type of data is that, sometimes, multiple points fall one on top of another, or very close together, therefore it can be hard to quantify the number of events. To overcome this limitation we’ll join this data to the Governorate layer to get a Count of actual events (you did something similar to this in exercise 5).
- Spatially join the point data onto the Governorate layer.
- Target = the polygon layer; Join_Features = the point layer
- Match option = Intersect (this way we will get a count of the number of points per polygon)
- Wait patiently for the result
- Open the attribute table and make sure you got a “Join_Count” column (it should be near the beginning of the table). Disregard the rest of the joined data
- Display the Column Join_Count in the resulting layer using Graduated Colors with 5 classes in quantiles.
- Create a beautiful layout showing the number of incidents that happened in the governorates of Syria during this time period.
- Make sure to zoom on Syria but show the background base map (or the neighboring countries layer, but not both) with some of the adjacent countries
- Do not show the points anymore, it’s not needed at this point
- Label the Governorates
- Use all the required components (title, legend, north arrow, scale bar, labels, grid, and your name)
- Export the resulting layout as a PDF, save it with your name and upload it to Moodle
Question 5. Upload your map of Syria to Moodle.
Part 3: Create a map of trees on campus
Now you are going to collect GPS coordinates of trees on campus in decimal degrees. Collect the coordinates of at least 10 trees in a particular quadrangle of the campus up to at least 6 decimals.
This work is easier if you go with a partner with a pre-made table in a notebook (or phone/tablet) with the corresponding columns (as shown in point 4 below).
- Pick 10 separate trees that have a tag.
- Stand next to each tree and record the coordinates.
- Copy from the tag the common name of the tree and the scientific name.
- Build an Excel table containing the fields: Tree#, Common_name, Scientific_name, Lat, Long.
Make sure coordinates are in DD format, AND longitude values are negative (if you recorded Lat-Long)
- Save the table in Excel format (or CSV).
I usually have better results using the Comma Separate Values (CSV) format; it’s simpler and less moody than an Excel table.
- Import the points in ArcGIS as shown in Part 2.
Create a Layout containing a suitable base map (Openstreetmap is nice) and your points on top using suitable (visible) markers. Label the trees with the Tree# column and add the attribute table to the layout (like you did in Ex 6 Part 2 #23). Add all the necessary components, including grid, to the map and upload to Moodle.
NOTE: You may map objects other than trees (e.g. trashcans, light posts, etc.) but you must include at least one attribute for these objects.
Question 6. Upload your map, as PDF, to Moodle.