Common map errors
Some common errors that show up in map layouts
This is a sample of some errors commonly find in some student maps.
Contents
Issues with scale bars
When you add a scale bar you have to make sure that the numbers and the bar itself are clearly visible and not obscured by the map details. See the following issues:
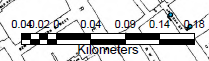
If the bar is too small some numbers may overlap each other and sometimes the numbers may get obscured by the map details.
You can avoid some of the problems by keeping the scale bar outside the map area. If the scale bar, or any kind of notes/labels, needs to go inside the map and you can’t find a clean/uncluttered section of the map where to put it, it’s best if you add a background to the bar/label. You can find how to do this under the properties (R-click) of the scale bar.
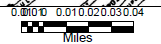
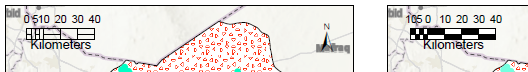
You also need to be consistent in your use of symbols. In the next figure the student used two different styles of scale bars (the same issue will be if they use 2 different north arrows, labels, etc.
Issues with labels
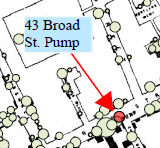
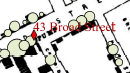
A similar problem with scale bars happen with labels. It’s important that they are clearly visible and not obscure by objects in the map. Also, it’s important that the labels DON’T COVER important details of the map. Compare the two images below, which one looks better?
Issues with legend
The legend is an important tool in a layout. It tells the user what it is that you’re showing in the map. SO, the legend must be clear, concise, and correct. Lot’s of issues with the legend can be corrected by using appropriate labels in the Content Pane. In the CP you can rename (R-click) the themes to use correct, clear, and concise words.
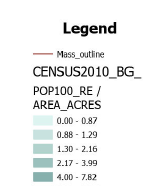
For example, look at the following legend for an upcoming exercise. It’s a map using a census theme called “CENSUS2010_BG” and it’s mapping two columns called “POP10_RE” and “AREA_ACRES”. Can you tell what this is????
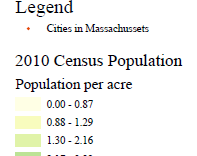
Wouldn’t it be better if we change the name in the CP of the theme and call it, for example, “2010 Census Population”? And the mapped columns , instead of “POP10_RE / AREA_ACRES” we use “Population density in people/acre”? See the next figure. The use of “units” is very important for numerical columns. For example if you’re mapping an area column and don’t show that the areas are in acres or square mile, etc. then the numbers don’t make sense.
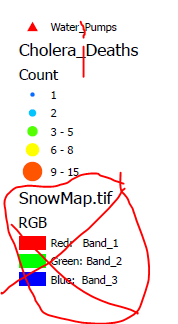
Another very common error is not removing the underscore that comes from the “filename”. The CP, by default, shows the filename, but you can change it to a correct format. For example, if the file is called “Cholera_Deaths” or “Water_Pumps” you must change these to “Cholera Deaths” or “Water Pumps” (without the underscores between words). See figure.
NOTE: Changing the name of the theme in the CP DOESN’T change the name of the original file, just the label inside the project.
Also notice the “useless” label that is shown in the CP about the background map “SnowMap.tif”. Background maps are rarely necessary in the legend, they’re usually self-explanatory. In this case you should have “erase” the labels in the CP or configure the legend properties (R-click) to remove this theme from the legend.
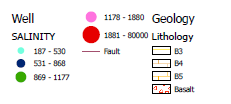
One final issue with legends is the design/style. The software offers multiple options you must choose one that shows correctly in the position and size that you choose. In the next figure the legend for salinity is split in 2 columns which makes it confusing.
It’s important legends are clear, concise, and correct.