Exercise 11b – Geocoding (with QGIS)

Geocoding (with QGIS)
- Geocoding some addresses in QGIS
- Objective: To create a layer of crimes in the city of Worcester, MA in 2014
Geocoding (with QGIS)
You will create a point layer showing crimes in the city of Worcester in 2014 by a process called geocoding that uses street addresses to locate the points. Crime data were obtained from crimereports.com (deadlink). In addition to the table of addresses, we’ll use an “Address Locator” (more on this later) provided by OpenStreetMap.
NOTE: You can also geocode with Arcgis PRO as well but it’s a paid service (but it’s covered in the college’s license). Here’s a training offered by ESRI (You’ll need to login to your AGO account)
The address locator requires a vector street layer containing house numbers for each street segment. Since houses are arranged as odd/even numbers on different sides of the street, the vector layer must have house numbers on both, left and right sides of the street. Fortunately this information has been compiled by the US census bureau in the street TIGER files. See the image below for a look at one section of streets between South Hadley and Chicopee.
The figure below shows columns of the TIGER file for Massachusetts (from MassGIS). Notice the street name (FULLNAME) column. Notice that there are multiple line segments for the same street. The rest of the columns indicate the range of house numbers found on the left and on the right for each segment:
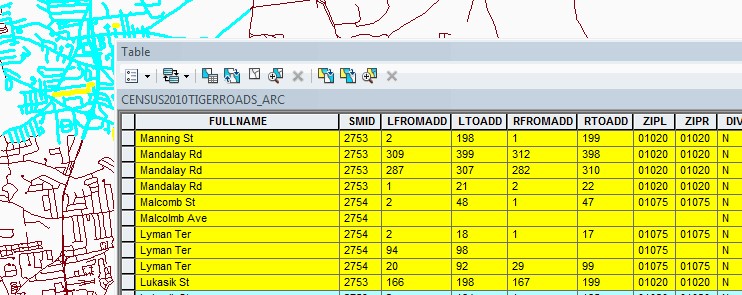
- LFROMADD – contains the house number that starts the segment on the left side (left from address). Same for RFROMADD for the right side.
- LTOADD – is the last house number found in the street segment on the left address (left to address). Same for RTOADD for the right side.
- ZIPL and ZIPR – these are the zip codes that can be found either on the left or right side of the street segment.
Be aware that this business of geocoding street addresses will vary enormously from country to country depending on the quality of the data and the situation of the addresses on each street in each country.
NOTE: This exercises uses a table with address of some crimes in Worcester called Crimes_Worcester_2014.csv. Find this table in the same \ex11 folder used for Exercise 11 – Intro to QGIS
- Create a new project in QGIS
- Add the table with crime data in your working folder (X:\user\ex11), Crimes_Worcester_2014.csv and examine its contents. (In the Data Source manager, you can use the Browser tab to find it)
Question 1. How many records are there?
Notice the column called “Web_Address”. This is how crimereports.com gave you the address. Obviously, it’s a degraded address. I edited those addresses (removed the word “Block”) and created a column called “Address”. The result of this operation is that all the crimes that happened in one particular block will be geocoded to the first address of the block.
The procedure we are going to use takes a long time, so we are going to get only a subset of the crimes in Worcester. For our purposes, we’ll only study the Drug related crimes.
- Select only “Drugs” from Crimes_Worcester_2014.csv
- Get the properties of the table in the Layers panel
- In the Source tab click on Query Builder
- Enter the expression Crime_type = Drugs (after choosing “Crime_Type” on the left window, push “All” button under the Values window to pick “Drugs”
- Click OK
- Export the selected records (302 records) as a Comma Separated Value (CSV) file (NOT a shapefile) and save it in your working folder.
Next, we’ll use a QGIS plugin. This is an external program that provides extra functionality to QGIS.
- In the top menu Plugins \ Manage and Install Plugins…
- Select All, on the left, then type “MMQGIS” in the search box, it’ll be listed in the center pane, select it and click install in the lower-right corner of the window. Close the Plugins dialog. Notice a new menu MMQGIS added to the menu bar on top.
- From the MMQGIS menu select Geocode \ Geocode CSV with Web Service
- Provide the csv file with the drug crimes as input
- The address fields should be populated correctly (address, city, and state). Make sure selections are correct
- Web server: US Census Bureau (this is an online server, make sure you have internet access)
- Enter output shapefile (SHP) and Not Found output list (CSV) in your working folder. Make sure this last one is in the right format (CSV).
- Click Apply and wait until finished (~2-3 mins depending on time of day)
NOTE: Notice that there are several web services to do the geocoding. The OpenStreetMap used to be good but it doesn’t seem to be working lately. The Google one requires a subscription. I haven’t used the ESRI one but I guess they also want a subscription, but we have an AGO account so it might work, try it.
- When the program finishes geocoding you can see the shapefile with the geocoded addresses. There will be some obvious errors (outside the city of Worcester). You can add the outline of Worcester any state towns layers you have (ex 5, 9). Those outliers need to be extracted, verified, and run again (we won’t do that here).
- Check the Not Found table. These addresses didn’t get “matched” to a street address, maybe a misspelled or wrong address. Depending on the importance of the job, you should try to fix those addresses and geocode them until there are no more unmatched addresses.
Question 2. How many unmatched addresses in the Not Found output csv file did you get? _____________ (It should be a very low number, hopefully)
- Open the table of the new geocoded layer and notice the new columns that have been created. These include a new address field (DISPLAY_NA) and Lat-Long among others.