Exercise 9 – Finding & creating data
Contents
- Part 1: Finding data and exploration of MassGIS & ArcGIS Online
- Objective: Explore the different layers available for download in MassGIS and upload data to ArcGIS Online
- Part 2: Digitizing line features
- Objective: To create a feature class of foot paths in one quadrangle of the MHC campus
- Part 3: Create a map of trees on campus using GPS XY data
- Objective: Create a map of trees in one MHC quadrangle from GNSS readings and import a table with X-Y data
NOTE: this exercise does NOT require any data from the class folder (N:\geog205)
Part 1: Finding data and exploration of MassGIS & ArcGIS Online
- Task 1: Exploration of the Q drive
- Task 2: Exploration of MassGIS
- Task 3: Uploading local ArcGIS Pro project to ArcGIS Online
- Task 4: Uploading local data to ArcGIS Online
Task 1: Exploration of the Q drive
- Before exploring MassGIS take a minute to explore the content of the Q:\ drive in the GPL using the Windows Explorer and ArcGIS Catalog view (or pane). Look into the following folders for available data:
- Data&Maps2023 – general data from Europe, USA, and the world (navigate to each sub-folder and load (drag to the CP or just double click) the .lyr files to visualize them
- USA_2024_2029_Demographic_Data – very detailed demographic data of the USA. Study the files in the \Documentation folder for content and variable names; it’s very long, a printed copy is saved in the cabinet where we keep the textbooks in the GPL
- Also look at the two digital data sources provided in the GIS resources page under Resources for learning GIS @ MHC (General GIS data & State GIS). Study them and look for something that you can use in your project.
Task 2: Exploration of MassGIS
- Go to the MassGIS data layers webpage and study the layers available for download. Look for possible data to use in your final project.
- Get the municipalities and police stations layers. Download either shapefile or GeoDB and expand (unzip) the files in a new working folder in your X:\user drive. Zip files can always be deleted after you expand them, BUT now keep at least one of them for Task 4.
- Load them into a new ArcGIS project and answer the following question (you should know how to do it by now without instructions).
Hint: There are a couple of town layers, either one should be fine but make sure it’s a simple, one polygon per town layer. There are 351 municipalities in MA, make sure you get a layer that shows this (351 polygons)
Question 1. How many municipalities (cities/towns) in Massachusetts don’t have any police station?
Hint: Google and Chatgpt give you, as expected, a wrong answer
- Remove any join or selections you might have made (if you did them, depends on your procedure) and save the project containing ONLY 2 themes: towns or municipalities AND police stations. Keep it simple, nothing fancy. We’ll use this for the next task.
Task 3: Uploading local ArcGIS Pro project to ArcGIS Online
- Open the project (if not open) that you saved above (#5).
- Go to the Share tap in the ribbon and click on Web Map in the “Share as” group.
- In the pane that opens on the right enter the following:
- Name: Towns & police stations in Mass. (or something suitable)
- Summary: something more descriptive of the layer if your name was not very clear
- Tags: Massachusetts, towns, police stations, (or any suitable)
- Select a Configuration: Copy all data: Exploratory
- Location: choose Create new folder and name it with a suitable name (e.g. policemass)
- Sharing Level: Organization (so we can see it, if necessary, otherwise “Owner” (if private) or “Public” (if sharing with others)
- Push the Analyze button at the bottom.
Analyze produces a series of errors that need to be addressed before uploading the data. Notice that errors with a red sign must be resolved before continuing. Yellow sign errors should not prevent you from continuing, they’re only warnings.
These errors are pretty much unavoidable. This rarely works without errors the first time. We’ll work on these errors by clicking on them. The example below addresses my errors which might be different from what you get.
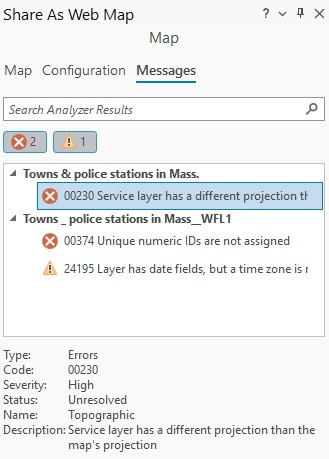
- Click each error and notice the description that it shows below.
- Error 00230 Service layer has a different projection …
- Error 00374 Unique numeric IDs not assigned – I guess that something needs unique IDs 😐
- If you get “Error 0026 In-memory joins ..” that’s because you forgot to remove any join (it might not be your case)
- To solve these errors, I did the following:
- Double click on each of the 00230 errors – they magically transform to error free (green)
- Unique ID error: double click on it and a Map Properties window opens. Under the General tab check the tick box that says “Allow assignment of unique IDs….” and push OK
- Push the Analyze button again and all errors should be clear now
- Disregard the yellow exclamation sign warning (241915 Layer has date….) or double click on it and add a time zone (UTC -05:00 Easter Time) in the windows that opens.
Note: You might encounter other errors, it all depends on your map (and the position of the stars? :-). Read the errors, double click them to see if you can figure out the solution
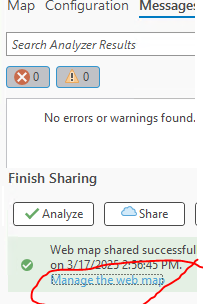
- Push the Share button at the bottom and wait for the process to finish (be patient).
- You’ll get a green message “Web map shared successfully”
- Click on the link “Manage the web map” and it’ll take you to ArcGIS Online
- Login to your AGO account and you will see your map there
- Click on the Open in Map Viewer button to open it in AGO
- The map can now be added to a Storymap you created.
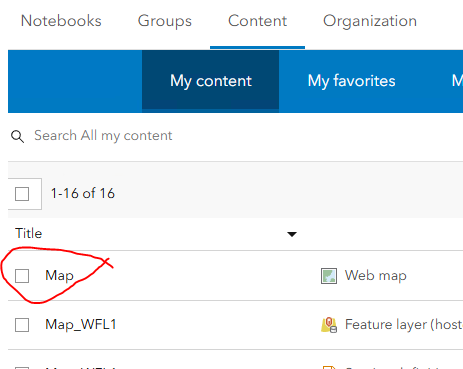
- If you don’t see the link, just go to your AGO account and you’ll find it under the Content > My content tab
Don’t close the AGO map, leave it open for the next task 4.
NOTE: Be aware that changes made to the map in AGO (such as adding a different basemap, etc.) won’t transfer back to the original version saved in Pro, and that you’ll likely need to refresh the StoryMap for edits made in ArcGIS Online to appear.
Another NOTE: the maps you see in AGO are images (screen shots) sent by the server. They do not contain the underlying data (e.g. shapefiles). Only if the author of the map has configured it in such a way that the data can be downloaded then you’ll be able to get the feature layers. The document “Sharing Data” shows you how to configure this simple map (police stations in Mass) to allow downloading data.
Question 2. Copy the URL of your map in ArcGIS Online and submit it in Canvas. Make sure it can be accessed by other people (try it on a different browser)
Task 4: Uploading local data to ArcGIS Online
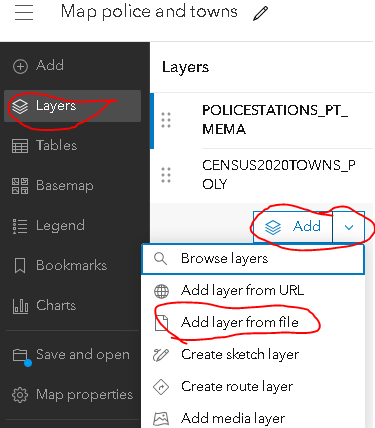
- With a window of the Map Viewer in AGO open click the Layers button on the left, then the down arrow next to Add and choose “Add layer from file”
- You can now drop the zip file with data from MassGIS save from task 2 or choose “Your device” and navigate to the folder the zip file is saved and upload it.
- Wait for the upload to complete and make sure that it’s visible in AGO CP
While you are in AGO you might want to explore the other buttons/options. Learn how to customize the legend (symbology) among other things. We’re not really using AGO in this course, we’re only using it as an intermediate step for sharing local data with a Storymap.
Part 2: Digitizing line features
Task 0 – Preparation
- Create new project (call it Digitizing or anything you like)
- Change the Basemap to OpenStreetMap
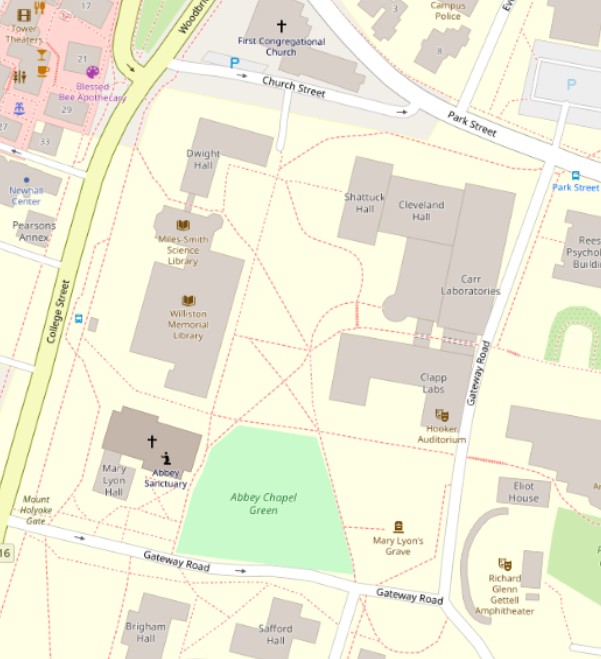
- Zoom in to MHC and then to the quadrangle in front of Clapp lab delimited by Church Street, Park Street, Gateway Road, and College Street (Rt 116).
Task 1 – Digitizing
Now that we have a georeferenced map image as background (our Basemap), we can use it in conjunction with other GIS layers to get georeferenced information from it. In our case, we’ll draw (digitize) the paths inside of the quadrangle of the MHC campus.
NOTE: This part requires an image with coordinates (georeferenced) or a reference map as background so we can “heads up” digitize on top of it. Sometimes we get non-georeferenced images, like scanned maps and images, that need to be georeferenced to be of any use in a GIS. This process of Georeferencing is not covered here but if you’d like to learn this, ask your instructor for an extra optional tutorial.
The process we’ll be doing next is called “Heads Up” digitizing.
The first step is to create an “empty” feature class (theme) of the right type (point, line, or polygon) then we “edit” it to add features.
- Go to the View tab and click on Catalog Pane (in the Windows group)
- In the panel on the right, find, under Folders\your working folder and notice the default GeoDB (e.g. digitizing.gdb) created when we made the map project.
- Inside the default GeoDB create a new feature class:
- Right click on this GeoDB in the Catalog pane then New > Feature Class (NOT Feature Dataset)
- Name the feature class Paths. For “Feature Type” make sure to use “Line”
- Uncheck both tick boxes under Geometric Properties (read what they’re for, but we won’t use them). Click Next
- The second screen allows you to define the attribute table, don’t add any field at this time, but here you can create the fields (attributes) that your features need. Click Next
- Under Spatial Reference (see note below) choose the coordinate system below Layers:
- Projected Coordinate System\State Plane\NAD 1983 (Meters)\NAD 1983 StatePlane Massachusetts FIPS 2001 (Meters) [NOT the one with the Isl suffix, that’s for the islands]
- Notice the name in the square Current XY; click the Details button and you’ll see the parameters that define the coordinate system called NAD 1983 StatePlane Massachusetts.
- Datum: NAD83 (North American Datum of 1983)
- Projection: Lambert Conformal Conic
- Linear Unit: Meters
- Etc.
- Close the window that opened (Coordinate System Details)
- Click Next.
- Accept the defaults for the next three screens (Tolerance, Resolution, Storage) and click Finish to create the feature class.
NOTE: We will be learning about these Spatial Reference topics in an upcoming lecture but you should become familiar with these important details.
You should now see a new empty line theme in the CP and a new feature class in the GeoDB. Examine the attribute table to verify it is empty.
The next steps describe how to digitize the paths (lines). It’s the same process as if you were drawing with your mouse in a program. Keep the following in mind as you work:
- Stay within the quadrangle. Don’t go across streets
- You’ll be clicking along the lines (or around the borders, if polygons) of your object until you reach the “end points”
- Every time you click, ArcGIS introduces a vertex in the line
- End each line with a double click (a node)
- Where 2 lines (paths) intersect make sure to click to add a vertex/node
- In long straight lines, you can click once at the beginning and then at the end of the straight line
- In curved or ragged lines, you have to click more frequently to represent the curves correctly
- Plan carefully before you start clicking away. NEVER draw the same line twice
- Use a suitable zoom level to make sure you can see good details
- For panning and zooming in/out while digitizing use the mouse wheel
- Once you have the digitizing tool selected avoid clicking anywhere but where you intend to. If you do click in the wrong place click on the keyboard Ctrl+Z (Control and “Z” keys together) to “undo” the last click(s)
NOTE: Read the following instructions first before you start clicking away
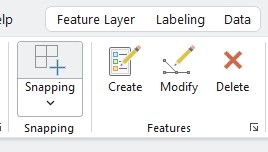
- Click on the layer name (Paths) in the CP and click the Edit tab in the ribbon,
- Click on Snapping (it’ll turn gray) to turn on snapping if it’s off. This makes sure that nodes snaps together as you are digitizing
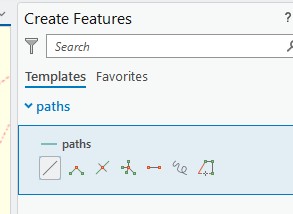
- Click the Create button. A Create Features pane opens on the right side of the screen
- Click on the new feature class (Paths) and some Construction Tools appear below
- Click the Line tool (first on the left) and the mouse cursor will turn into a cross hair
- Zoom in to a corner of the quadrangle and start a line (path) by clicking on one end and click along it until you reach the end with a double click
- Remember to add clicks (vertices) at intersections
- These steps require a lot of zooming in/out and panning. Be careful.
- The recently made line should be selected and it should be shown in light blue
- When creating a new line that will overlap a previous one notice that the cursor “should” snap to the vertex created in the previous line. Click on the snapped vertex and keep drawing.
- Continue creating paths until you draw all the paths inside the selected quadrangle.
- If you make mistakes use Ctrl+Z to undo the last vertex (multiple Ctrl+Z will keep undoing vertices).
- To correct other errors:
- If a line or vertex needs to be moved
- Click the Modify button in the Features group in the Edit tab. Notice the Modify Features pane on the right. Study the multiple tools but only click the one under Reshape\Edit Vertices. This tool is also available in the Ribbon in the Tools group
- Double click on a line and the vertices will become visible, then you can move them to a better place.
- To delete a whole line go to the Map tab and under the Selection group choose the Select tool.
- Click on the line to delete to select it, it should turn blue, then push delete in your keyboard.
- Continue digitizing the paths inside the quadrangle. Stop each line at the streets.
- When happy with the results click the Save button in the Edit tab – Manage Edits group (or Discard if you hated it!)
You would follow this general procedure if you were creating a point theme or a polygon theme (of course each one has its own minutiae). Feel free to add a new point and/or polygon feature class in the GeoDB and add some points (e.g. but stops) and polygons (maybe a couple of buildings) respectively if you want to practice more.
- Save the project and use it to add the GPS points (trees) that you’ll create in part 3 of the exercise.
Part 3: Create a map of trees on campus using GPS XY data
Here you will create a vector theme of the distribution of trees on campus
Task 1 – Adding XY data
There are multiple ways to add XY data in ArcGIS. The simplest is to use the Go to XY button on the Map tab of the toolbar (see figure below). This allows you to enter one by one data in different units, depending on what you have and the coordinates of the underlying map. This is a very quick way to add a few points (maybe collected with a GPS during a field trip), but it’s not convenient when we have many points.
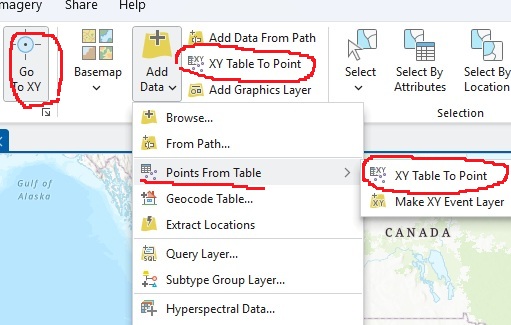
The most efficient way to add XY data is to create a table, with a suitable software (like Excel), containing the X and Y coordinates (in decimal degrees, not DMS) of your locations, along with any other extra data you may have about each location (attributes). Then you use the XY Table to Point buttons (shown in the figure above in 2 parts, same button) in the Layer group of the Map tab.
To avoid compatibility problems, I always make a simple table in Excel using simple headings (short file name, no spaces, and short column names). In theory, you should be able to directly access the data from an Excel table.
NOTE: Always make sure that values of Lat or Long have, if necessary, negative signs. In the case of coordinates for the US Longitude values must be negative.
NOTE 2: You may map objects other than trees (e.g. trashcans, light posts, etc.) but you must include at least one attribute for these objects.
Now you are going to collect GPS coordinates of trees on campus in decimal degrees. Collect the coordinates of at least 10 trees in a particular quadrangle of the campus up to at least 6 decimals.
This work is easier if you go with a partner with a pre-made table in a notebook (or phone/tablet) with the corresponding columns (as shown in point 4 below).
- Pick 10 separate trees that have a tag around (but not necessarily all inside) the quadrangle area that you digitized in Part 2.
- Stand next to each tree and record the coordinates with a GPS from the GPL or from your phone.
- Copy from the tag the common name of the tree and the scientific name.
- Build an Excel table containing the fields: Tree#, Common_name, Scientific_name, Lat, Long.
Save the table in Excel format (or CSV).
- I usually have better results using the Comma Separate Values (CSV) format; it’s simpler and less moody than an Excel table.
- Import the points in ArcGIS as shown on task 1 (part 3) above.
Create a Layout containing an imagery basemap and the layer you digitized in part 2 above and your points on top using suitable (visible) markers. Label the trees with the Tree# column and add the attribute table to the layout (like you did in Ex 6 Part 2 #23). Add all the necessary components, including grid, to the map and upload to Canvas.
Question 3. Upload your map, as PDF, to Canvas.