Manipulatives are objects that a learner can feel and manipulate in order to better understand a concept. They are excellent tools for learners who benefit from active, hands-on instruction and they are invaluable for learners who are blind or have a visual impairment when verbal instructions alone are not adequate to teach a concept. Blind and visually impaired learners must, “experience relationships with real objects in order to prepare them for understanding the same relationships with numbers” (Osterhaus, 2011). Consequently, manipulatives are great teaching tools for statistics!
Here are some manipulatives we recommend and instructions on how to use them. Be sure to check out the 3D Toolkit to learn more about how you can get these and other helpful teaching tools for FREE!
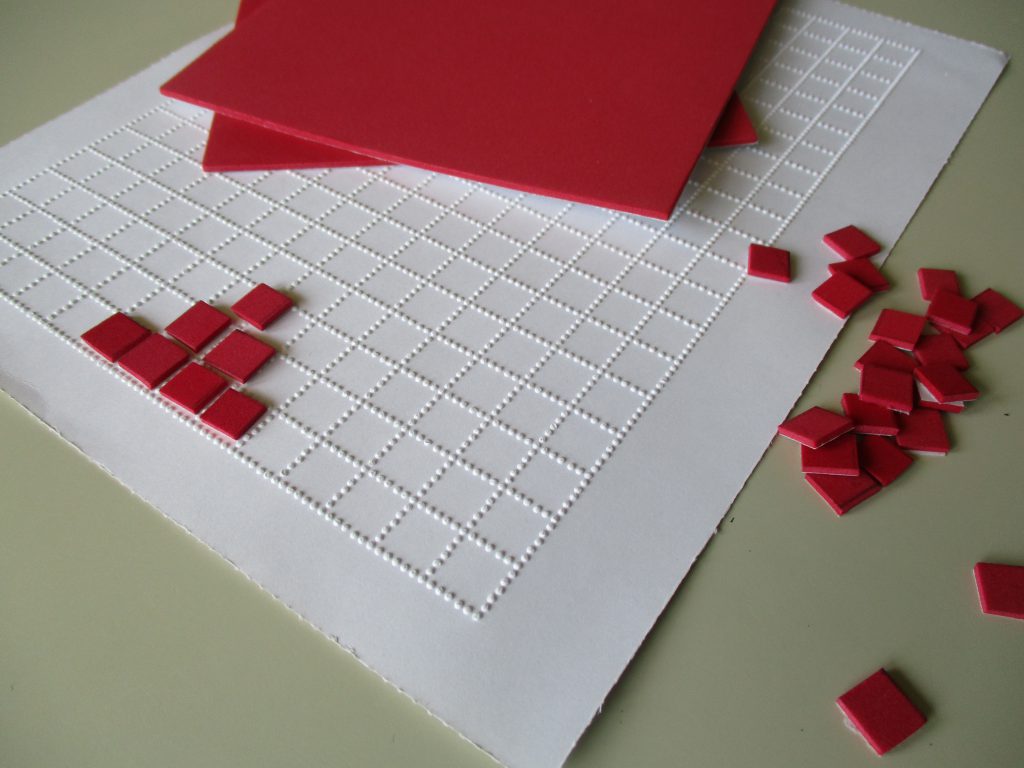
Sticky back foam sheets & Braille graphing paper
Cut sticky back foam sheets into squares that fit into the cells of Braille graphing paper to make tactile distributions. Learners who are blind or visually impaired can feel distributions the instructor has made or make their own. When sharing pre-assembled distributions, start by orienting the learner to the x and y axis and then give them time to feel the shape and scope of the distribution before giving further instructions. Putting Braille numbers on the x and y axis isn’t necessary if each row and column has a value of 1 but may be helpful if the values are larger. These manipulatives are best for small data sets so the learner can feel the entire distribution more easily.
Hardboard distributions & Wikki Stix
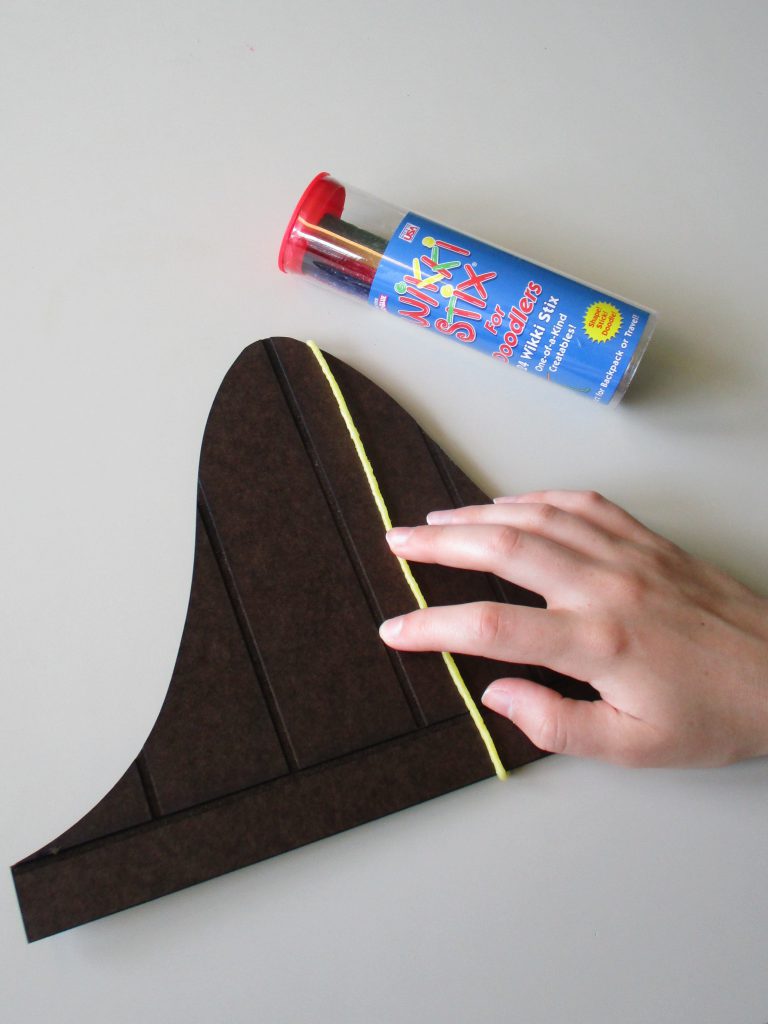
With the help of the Makerspace staff at Mount Holyoke College, we created three hardboard distributions: one positively skewed, one negatively skewed and one symmetrical. We also included lines etched into each distribution to indicate the relative position of the mean, median and mode. The hardboard distributions allow learners who are blind or visually impaired to feel the different shapes of the curves and, with the help of the etched lines, learn where the mean, median and mode fall on each curve.
Wikki Stix are made of yarn covered with non-toxic wax and stick to any smooth surface when you gently press them down. They can be placed and replaced easily without leaving a mark. Using Wikki Stix, instructors can mark a specific value (e.g., a z score) on a distribution. On the symmetrical distribution below, the Wikki Stix marks a value between the mean and +1 standard deviation from the mean.
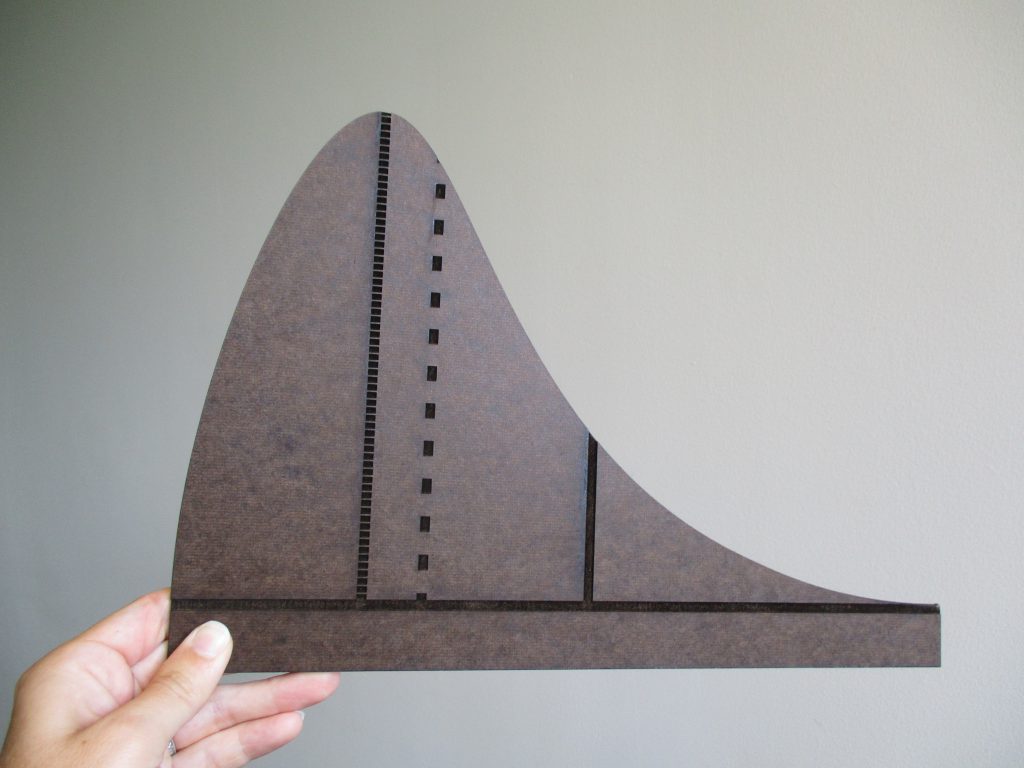
Above is a positively skewed distribution where the mean is indicated by the solid line, the median by the line with long dashes and the mode by the line with short dashes.
References
Osterhaus, S. A. (2011, March). The use of manipulatives as an instructional strategy to help students who are blind or visually impaired understand and learn math concepts (early childhood through secondary). Presentation given on behalf of the Texas School for the Blind and Visually Impaired.