
Mechanical Properties of Soft Materials – Bacterial Biofilms
The Atomic Force Microscope can measure mechanical properties of materials, including adhesion and stiffness. This is most often accomplished by what is known as a “force curve” which plots force on the tip vs. distance (Figure 1). As the tip approaches the surface, it is in its neutral position. Just before it touches the surface, it may deflect downwards to the surface, due to attractive forces. As the tip continues to be lowered, the amount it deflects and how far into the surface it depresses depends on the stiffness of the material. (Imagine pushing a meter stick down into a pillow compared to a table top; for the pillow, it pushes down and may bend slightly while for the table it bends a lot and may push in slightly.) The slope of the force curve indicates the stiffness of the material – careful models are required to to extract parameters like young’s modulus. As the tip is retracted, it may stick to the surface if there are adhesive forces, causing the tip to bend down before often “popping” off, a sudden change in the deflection as adhesive forces are overcome. Force curves on homogeneous materials are more straightforward to interpret, and can yield information about viscoelasticity and poroelasticity in the case of a material like a hydrogel. For a heterogeneous sample like a bacterial biofilm, there is a wealth of information contained within the force curve. Our lab has studied a few different biofilm-forming bacteria along with the predator bacteria Bedellovibrio bacteriovorus in collaboration with Megan Nunez, Eileen Spain, and Megan Ferguson.
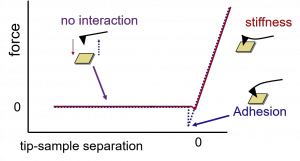
Figure 1: Schematic of a typical force curve. As the tip is lowered towards the surface (left to right on the graph, red curve), there is no interaction and zero force. As it encounters the surface, the force increases, and the tip depresses into the surface. When the tip reverses direction (blue curve), there may be hysteresis (not shown). The tip often adheres to the surface, creating a negative force. When the force is high enough, the tip may “snap” off the surface, allowing us to measure the strength of adhesion.
Microorganisms, such as bacteria, can form communities on surfaces called biofilms. As certain kinds of these films play a role to spreading infectious diseases, there is a need for a greater understanding in their behaviour in order to preserve the public health. In particular, if we can understand how the biofilms adhere early in their formation, it might be possible to inhibit or prevent adhesion.
One challenge in working with bacteria is simply imaging them. A range of methods exist to artificially fix bacteria to the surface, in fluid. Some of these methods may change the properties of the bacteria. Once fixed, it can still be challenging to image the bacteria because imaging in fluid is generally more finicky and sticky surfaces create additional complications – imaging trying to tap your finger a long a sticky note; as you stick to the surface for a moment, you alter your image. Figure 2 shows height images of bacteria natively adhered to a surface.
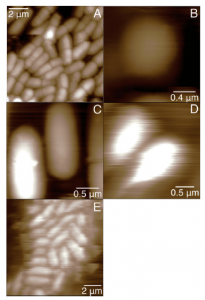
Figure 2: Images of bacteria natively adhered to the surface in fluid. (A) B. subtilis. The height (Z-axis) scale is 800 nm. (B) M. luteus. The height scale is 600 nm. (C) E. coli ZK1056. The height scale is 400 nm. (D) P. putida. The height scale is 600 nm. (E) E. coli ML35. The height scale is 800 nm. From Volle, et al., Colloids and Surfaces B, 67 (2008)
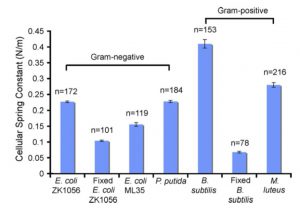
Figure 3: Cellular spring constants for natively adhered bacterial biofilm cells and chemically fixed planktonic cells. The spring constant is calculated from the linear region of the extension curve. The error bars represent the standard error for each data set. The number of force curves averaged is n.
Generally, adhesion forces are measured with a regular silicon tip or a spherical bead with a chemical coating. We instead grew a biofilm of E. coli directly onto a tipless cantilever (Figure 4), before bringing it into contact with different chemical coatings on a silicon wafer (Figure 5).
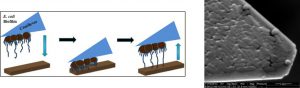
Figure 4: To directly measure adhesion of E. coli to different surfaces, we grow a biofilm of E. coli onto a tipless cantilever. We bring the tip into contact with surfaces that have different coating to measure the adhesion between the tip and the surface.
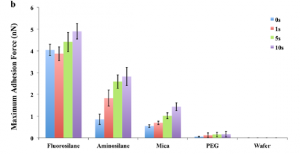
Figure 5: The maximum adhesion force is largest for fluorosilane and smallest for the PEG coated silicon wafer. See Hu et al., Langmuir, 29, 2000-2011 (2013) for more information.