

Abstract
Amherst College Library has access to a college-wide Google Analytics account, which provides information on pageviews, time on page, clickpaths, and devices used, among other metrics. The Web Group reviews this information as needed to inform specific projects and set priorities.
Goal/Question
In keeping with our mission of fostering inquiry, discovery, and creation, the Library seeks to connect our users with the information they need. The Web Group generates regular reports monitoring various areas of our site to answer questions including:
What are the Library’s most-viewed pages? What percentage of users navigate the Library website on desktop, mobile, and tablet? How have pageviews of research guides, course guides, and other pages changed over time? How do users get to Library pages?
Methods
- Website metrics
Statistics/Data
Sample size: All users, in aggregate
Dates: 06/01/2017 — ongoing
Campus/College: Amherst College
Contact: Kelly Dagan, Library Web Group chair, kdagan (at) amherst.edu
Outcome
Results
Sept 1, 2016 – December 31, 2017
Top Pages:
- Homepage (over 58%)
- A-Z Databases (3%)
- Find Resources (2%)
- Hours (2%)
- Archives (1%)
- Research Guides (1%)
- My Account (1%)
- Jobs (1%)
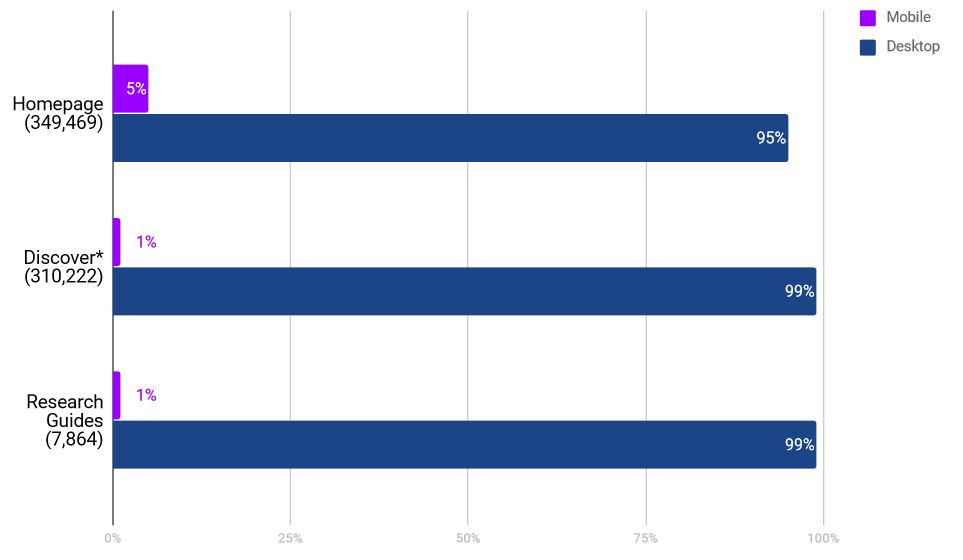
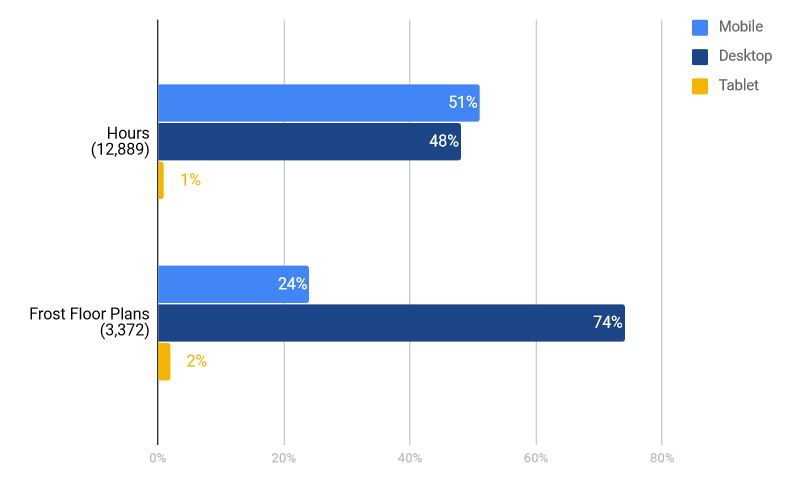
The majority of traffic to the Library homepage and major search tools continues to be desktop-dominated, but there is increasing mobile traffic on quick-reference pages like hours and floor plans.
Previous page paths to the research guides landing page as well as specific research guides suggest a significant practice of Googling to get to Library pages, rather than navigating within the site structure. This finding has been reiterated with recent testing on the floor directory page.
Comparing equivalent periods from 2016 and 2017 (Sept 1 – Dec 31), this year has seen a 25% increase in unique pageviews of Find Resources. A-Z Databases saw a 1% drop from last year, but unique pageviews are still 31% higher than in 2015. The research guides saw a 4% drop from 2015, and a 14% drop from 2016.
Recommendation
Further analysis will continue in relation to new and existing projects; designs of quick-reference pages (hours, floor plans, etc) should be mobile-oriented, to accommodate growing traffic. Current usability testing has already started integrating mobile testing processes.
Further analysis of analytics should integrate goals, mapped to user behaviors that indicate engagement with our resources, services, and staff.
Related links
- Turner, Steven J. “Website Statistics 2.0: Using Google Analytics to Measure Library Website Effectiveness.” Technical Services Quarterly, vol. 27, no. 3, July 2010, p. 261 http://ezproxy.amherst.edu/login?url=http://search.ebscohost.com/login.aspx?direct=true&db=edb&AN=51174625&site=eds-live&scope=site